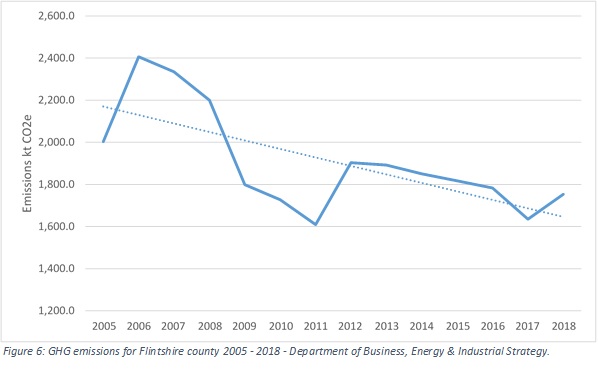
Flintshire county GHG emissions
Flintshire county has seen an overall reduction in GHG emissions since 2005 as shown in Figure 6. The emissions during this time have had periods of increase specifically around 2011/12 and 2017/18.
Flintshire County GHG Emissions by Sector
| Calendar Year |
Industrial & Commercial |
Public Sector |
Domestic Energy |
Transport |
LULUCF Net Emissions |
Agriculture |
Waste |
| 2005 |
1141.5 |
31.6 |
416 |
422.1 |
20.2 |
184.8 |
359.5 |
| 2006 |
1542.7 |
33.3 |
417 |
426.3 |
17.8 |
173.9 |
338.8 |
| 2007 |
1491.6 |
31.1 |
399 |
428.8 |
16 |
183 |
281 |
| 2008 |
1343.6 |
29.6 |
398.8 |
415 |
16.5 |
176.5 |
243.1 |
| 2009 |
1001.1 |
25.4 |
366 |
402.4 |
15 |
171.6 |
208.4 |
| 2010 |
914.4 |
25.8 |
393.2 |
392.2 |
14.3 |
172.6 |
200.2 |
| 2011 |
880.1 |
22.6 |
339.1 |
381.1 |
13.9 |
168.2 |
139 |
| 2012 |
1147.7 |
26.8 |
360.5 |
373.6 |
16 |
171.5 |
109.1 |
| 2013 |
1155 |
25.6 |
351 |
369.7 |
13.3 |
157.7 |
103.4 |
| 2014 |
1154.7 |
22.1 |
298.6 |
377.1 |
12.4 |
171.8 |
75.3 |
| 2015 |
1122.2 |
19.3 |
294.7 |
388 |
10.5 |
168.2 |
60.8 |
| 2016 |
1091.5 |
16.9 |
274.6 |
403.8 |
7.9 |
157 |
69.1 |
| 2017 |
947.7 |
16.6 |
263.1 |
403.8 |
7.7 |
158.1 |
47.8 |
| 2018 |
1081.4 |
14.3 |
263.2 |
403.8 |
6.7 |
152.7 |
24.9 |
| 2019 |
985.3 |
11.8 |
254.1 |
398 |
5.6 |
152.6 |
38.7 |
| 2020 |
899.9 |
13.2 |
246.5 |
309.2 |
3.7 |
156.6 |
78.5 |
| 2021 |
1022.4 |
15 |
245.9 |
346.6 |
2.8 |
161.6 |
62.8 |
| 2022 |
944.1 |
15 |
216.2 |
349.9 |
1.7 |
154.8 |
45.5 |
Figure 7 provides a further breakdown of the emission sources that contribute to the County’s overall GHG emissions from 2014-2018*. Largest contributors to this footprint are large industrial installations and road transport. There are significant industrial areas in the county including Deeside, and the heavily used coast road also runs the length of the county.
Flintshire County Council is responsible for approximately 3% of the County’s GHG emissions.
* most recent year data is available from Department of Business, Energy & Industrial Strategy.